Visualise Your Data Directly in Google Data Studio with Unite
Send Google Ads, Meta, TikTok, Shopify and more straight into Google Data Studio with Unite. No warehouse, no CSV exports, no code.


Introduction
Google Data Studio (formerly called Looker Studio) is great at turning data into charts and charts into reports. But, getting the data into it is the part that falls apart.
If everything you report on lives inside Google, you are covered. Data Studio ships with free native connectors for Google Ads, GA4, Search Console, BigQuery, Google Sheets, etc. The moment you need Meta Ads, TikTok, LinkedIn, Shopify or Stripe next to those numbers, you are into CSV exports and spreadsheets that someone has to refresh every other day, or a separate connector subscription for every platform.
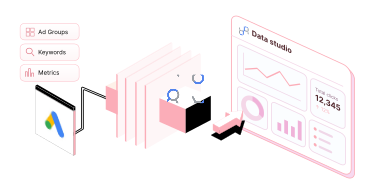
Unite's Data Studio destination removes that step. You build a pipeline in Unite, choose Data Studio as the destination and you're all set to visualise your data in Data Studio. No warehouse in the middle, no spreadsheet, no code.
This guide walks through the whole thing, using Google Ads as the example source.
Why use Unite as your Data Studio connector?
One method for every source. Google Ads, Meta Ads, TikTok, LinkedIn, Amazon Ads, Shopify, Stripe, HubSpot, Salesforce and more, all connect the same way. Get the hang of it once with Google Ads and the next source takes a couple of minutes.
Reports that are already built. Each source comes with pre-built reports covering the fields people actually use, so you don't need to figure out which metrics to choose. If you need something different, build a custom report using your own dimensions and metrics.
Room to grow. You can start without a data warehouse. When you need one later for full data history or SQL joins, simply duplicate the pipeline and send the data to BigQuery.
What is different about the Data Studio as a destination in Unite?
With most Unite destinations, such as BigQuery, Snowflake or Google Sheets, you set up the destination first in the Destinations section and then point pipelines at it.
Data Studio skips that step. There is no destination to set up in Unite first. You choose your source, your accounts and your reports, and when the pipeline asks where the data should go, you select Data Studio directly. That is the whole difference, and it is why this is the fastest destination in Unite to get running.
Connect your data to Google Data Studio with Unite
Before you start, you will need:
- A Google or a Google Workspace account. Data Studio is free and runs on any Google login.
- A Unite account. The 15 day free trial is enough to follow along.
- Login access to the source you want to report on, in this case Google Ads.
The setup has three parts: find Unite in Data Studio, build a pipeline in Unite, then bring that pipeline into a report.
Part 1: Find Unite in Data Studio
1. Open Data Studio and create a report
Go to Data Studio and click Create, then Report. Data Studio will immediately ask which data source you want to connect.
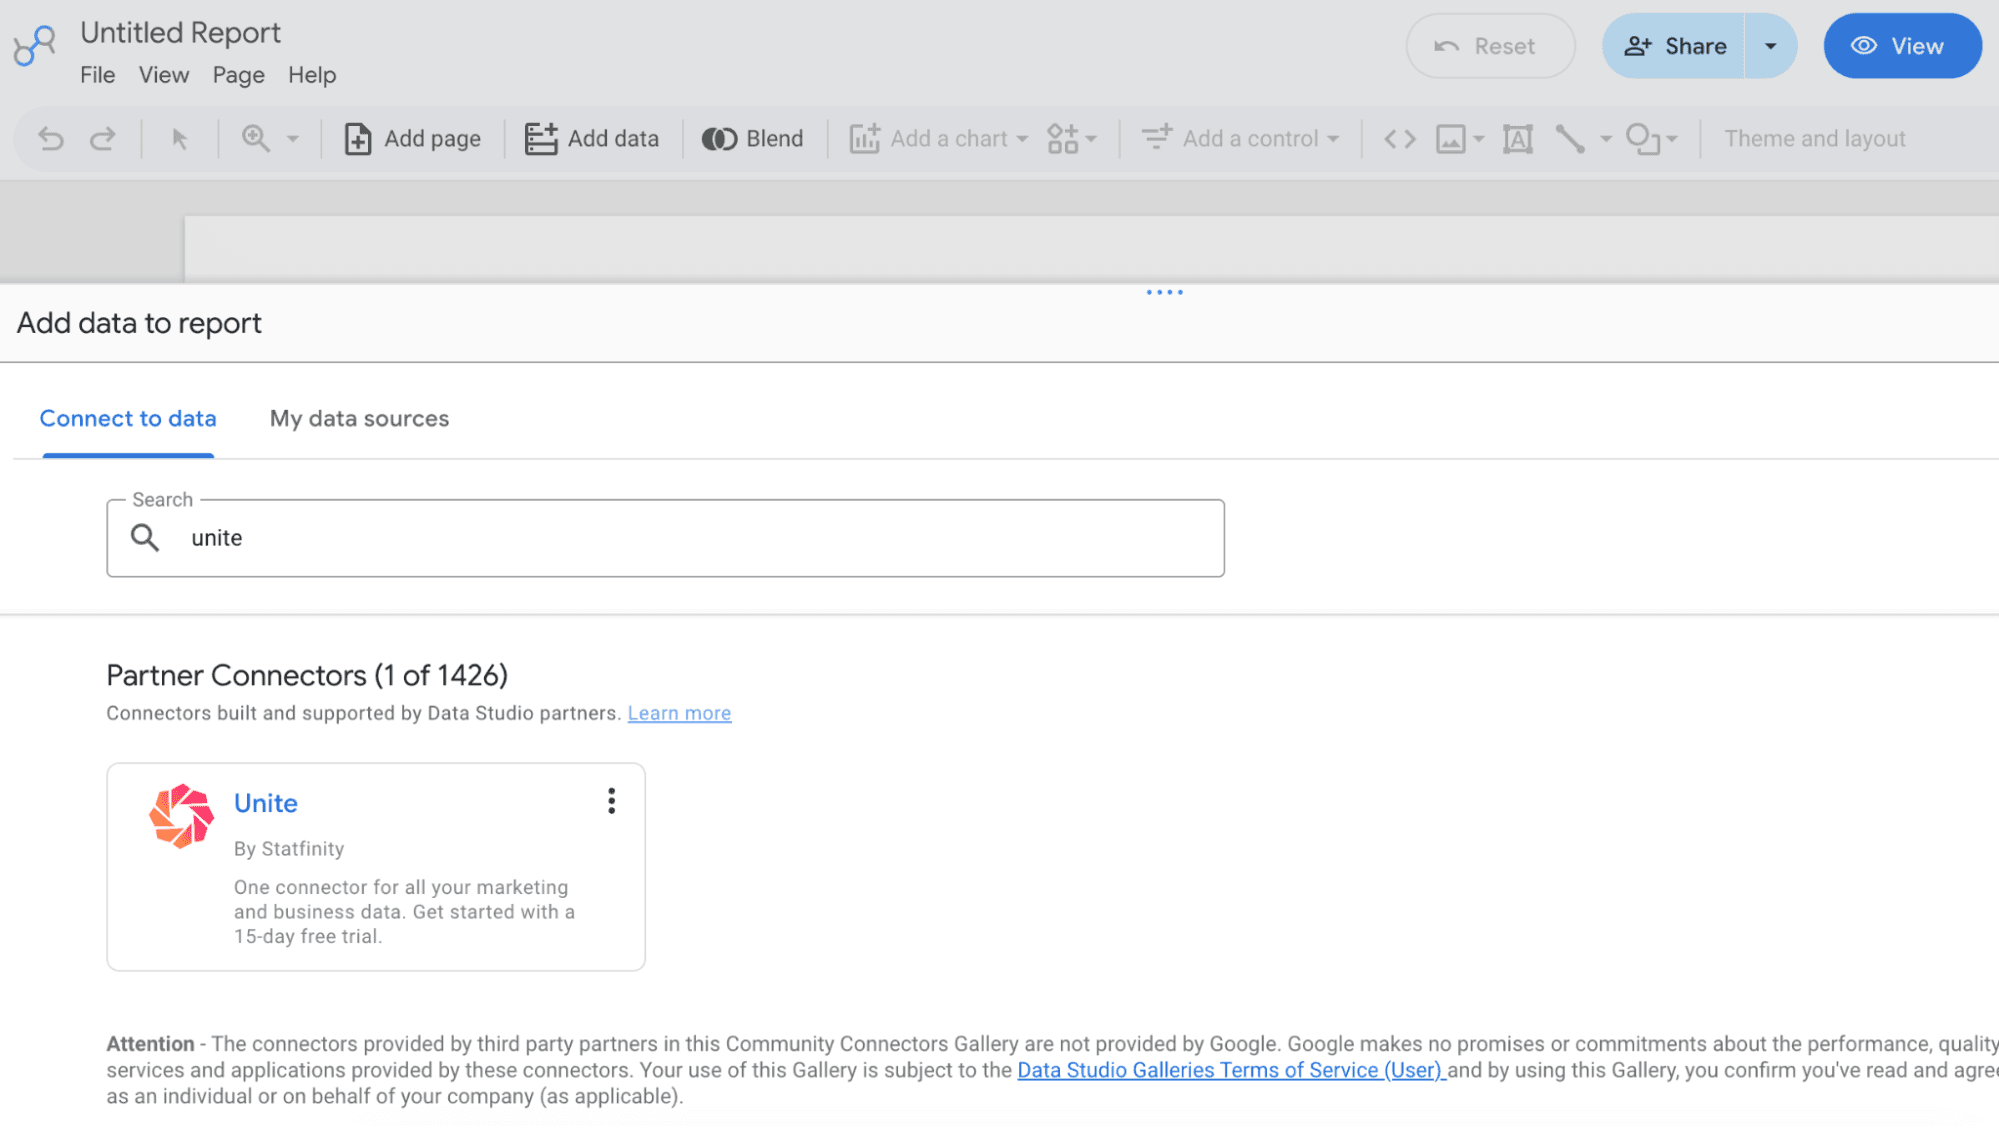
2. Search for Unite
In the list of connectors, search for "Unite". You will find it under “Partner Connectors”. Select it.
3. Authorise your account
The first time you use Unite in Data Studio, you will be asked to authorise it with your Google account. If you have done this before, you will go straight through.
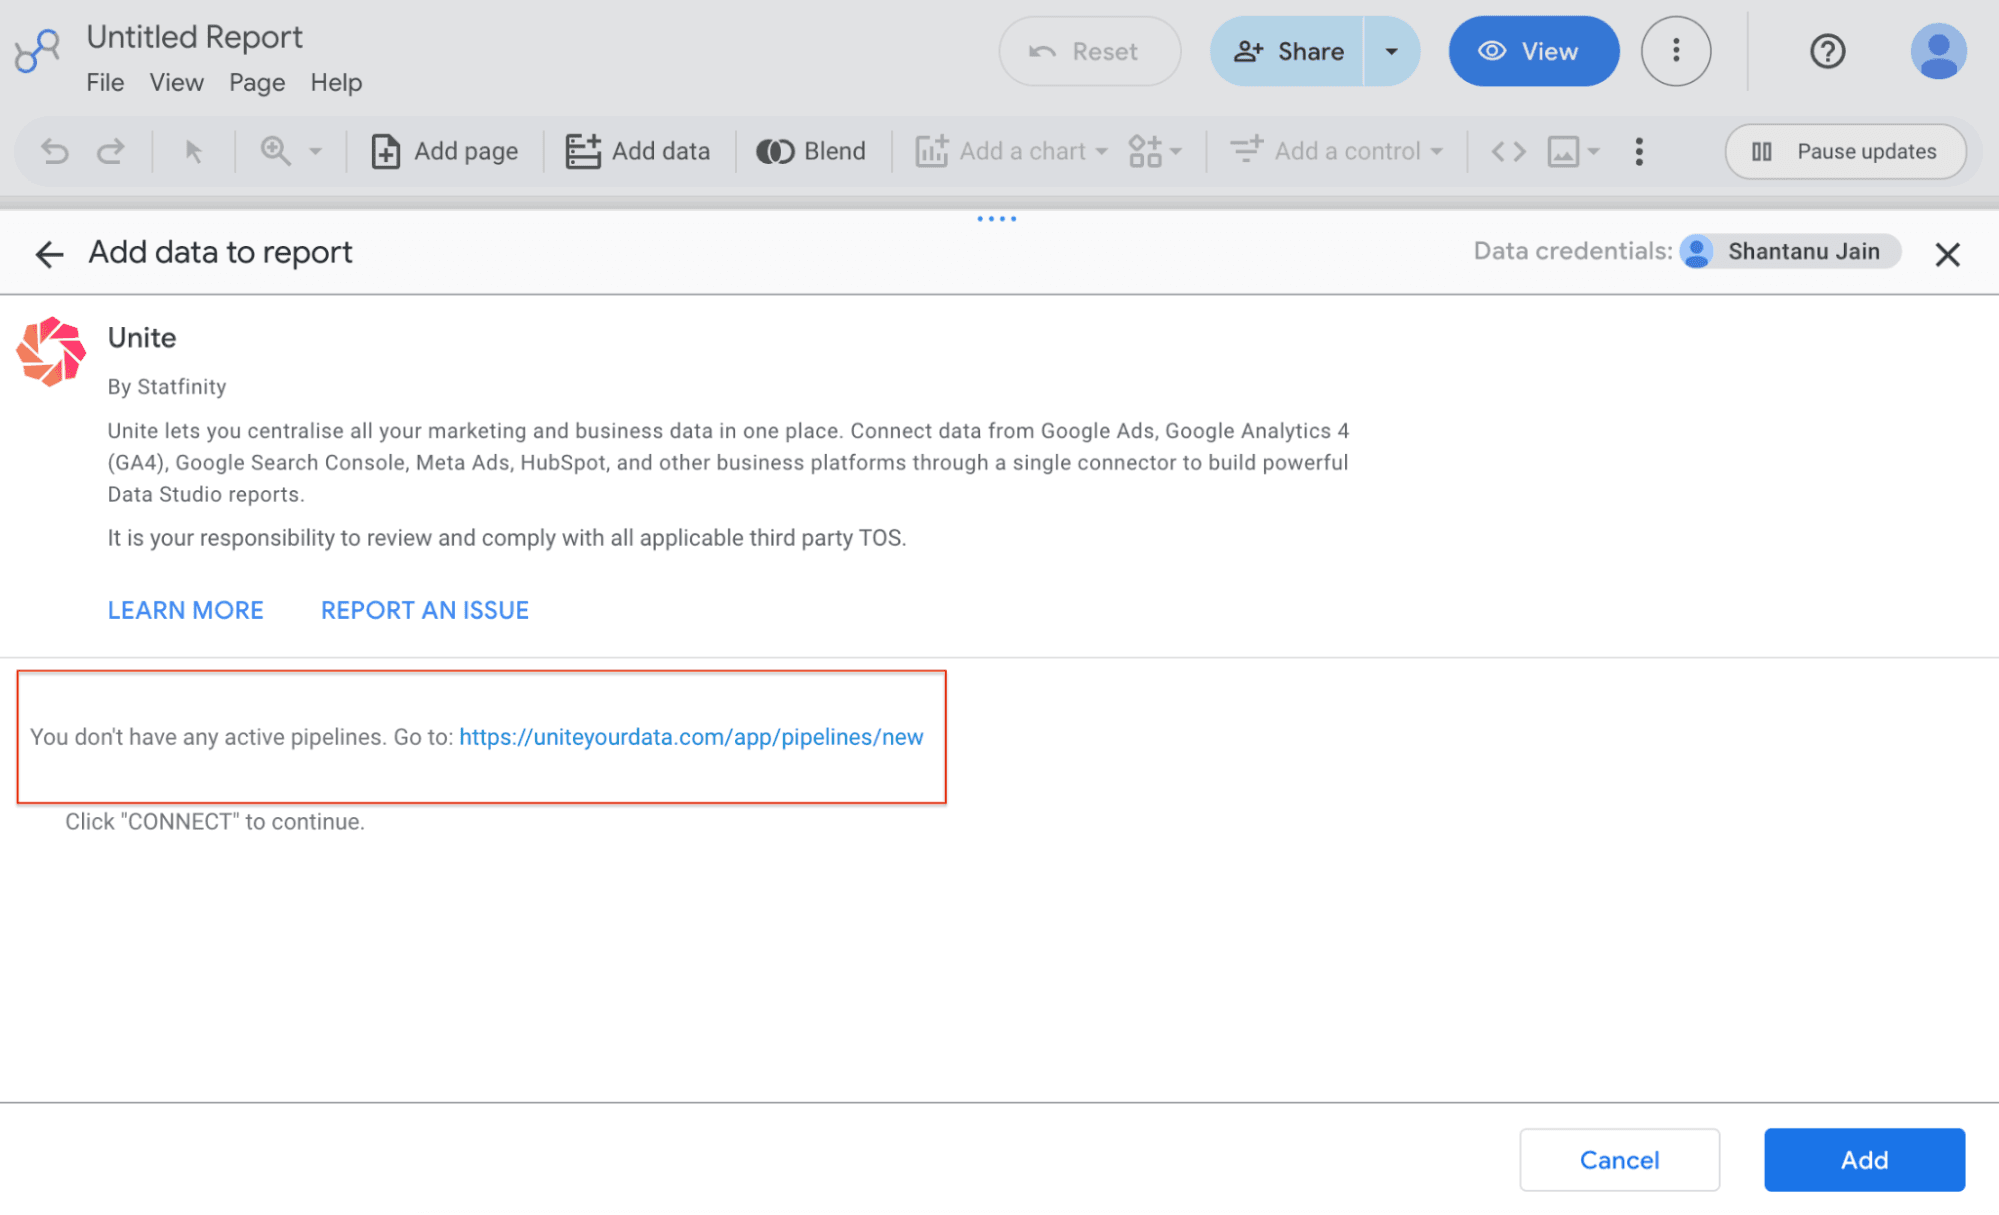
At this point Data Studio will tell you there is no pipeline to choose from yet. That is expected. The pipeline is created in Unite, so leave this tab open and switch over.
Part 2: Build a pipeline in Unite
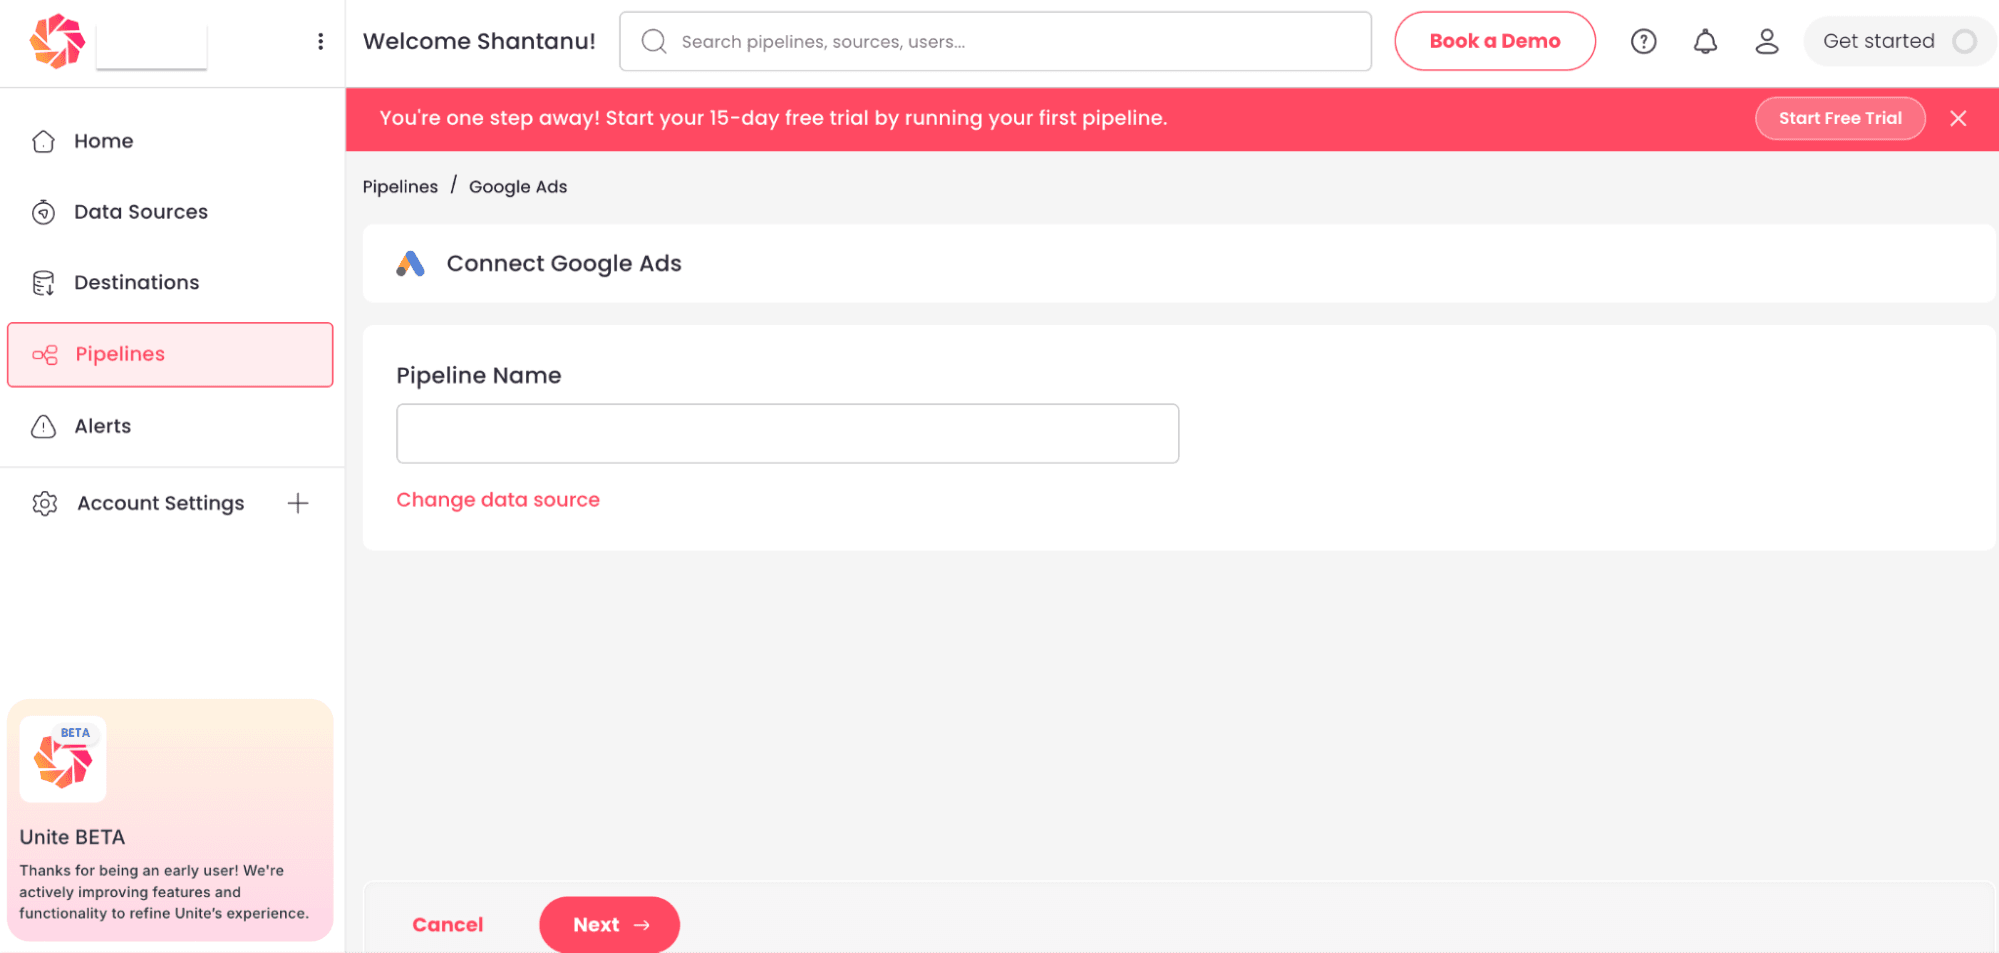
4. Create a new pipeline.
In Unite, start a new pipeline and choose your data source. For this walkthrough that is Google Ads.
5. Name it.
Pick something you will recognise later in a dropdown, for example "Google_Ads, Data_Studio, monthly_performance". It sounds minor, but once you have six pipelines, "Pipeline_1" helps nobody.
6. Choose your credential account.
Select the Google Ads login Unite should use.
7. Select the accounts to pull from. If that login has access to several ad accounts, tick the ones you want in this report.
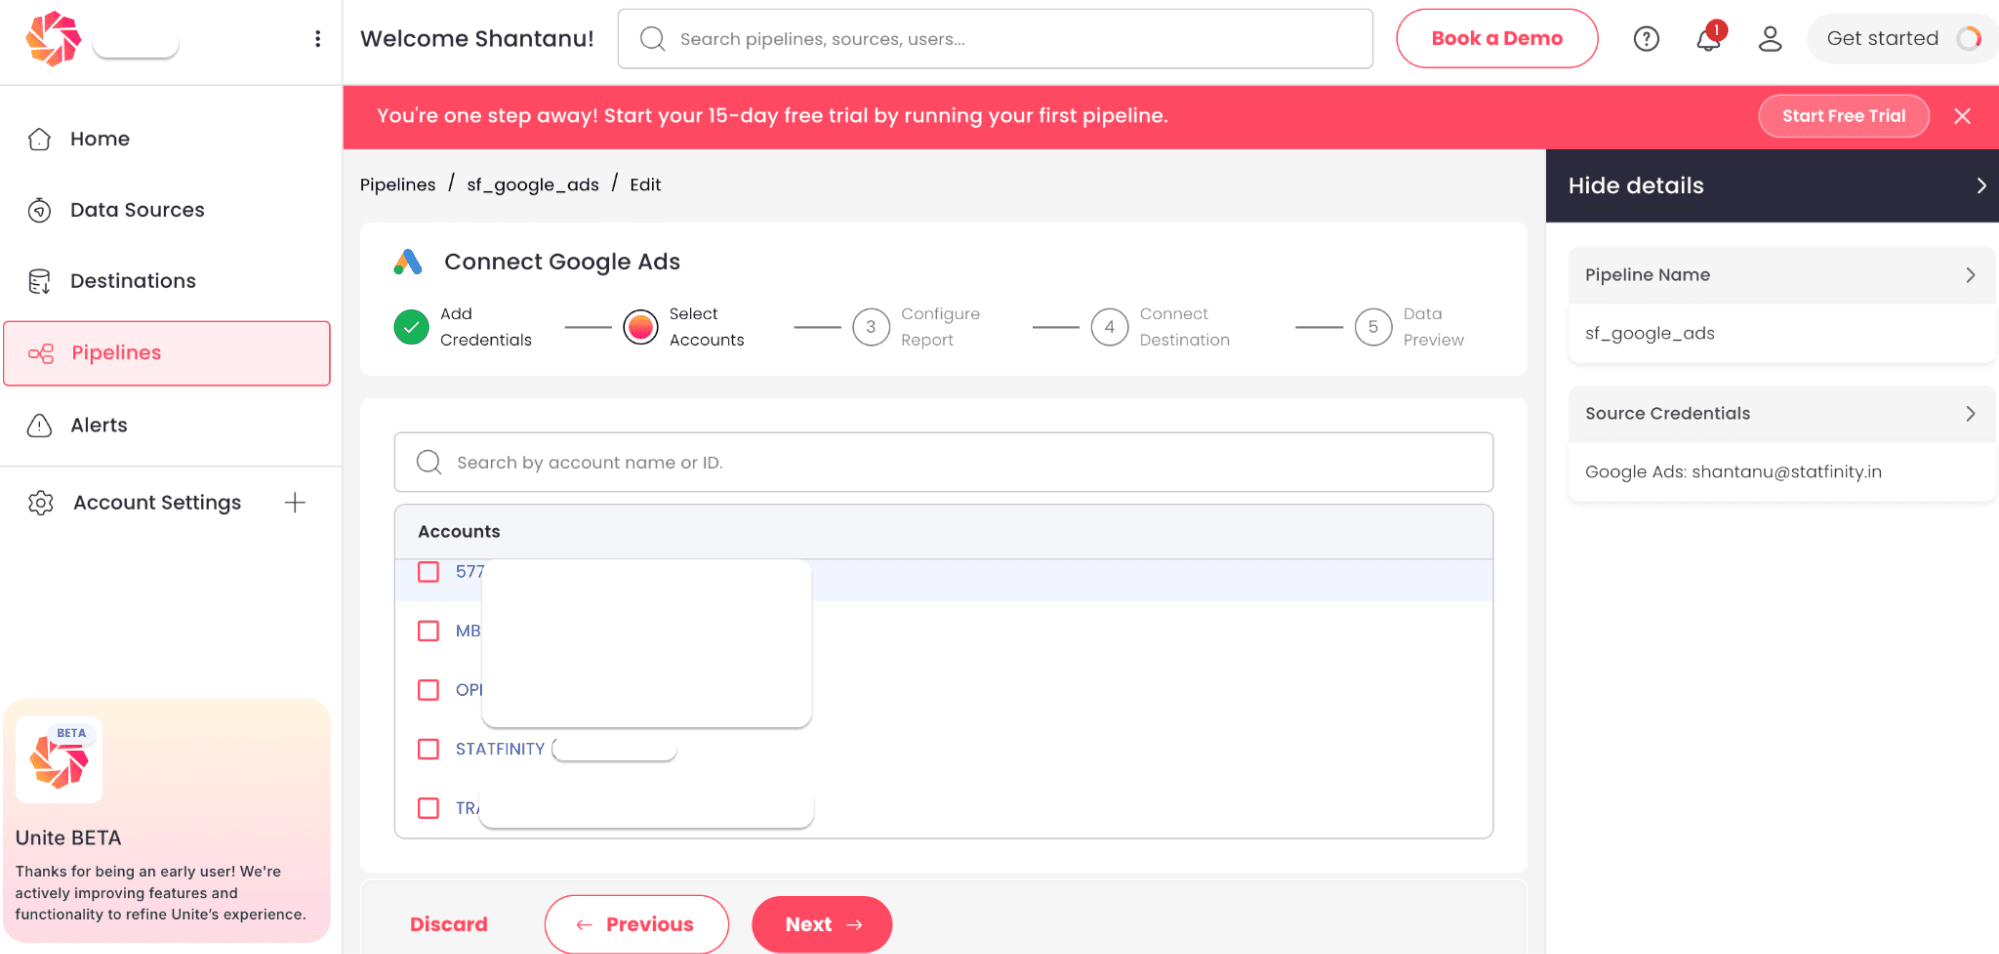
8. Pick your reports.
Choose from the pre-built reports, or create a custom one by selecting your own dimensions and metrics. For most first dashboards, a pre-built report is enough.
9. Select Data Studio as the destination.
This is the step that differs from other destinations. Rather than picking a destination you set up earlier, select Data Studio directly from the list.
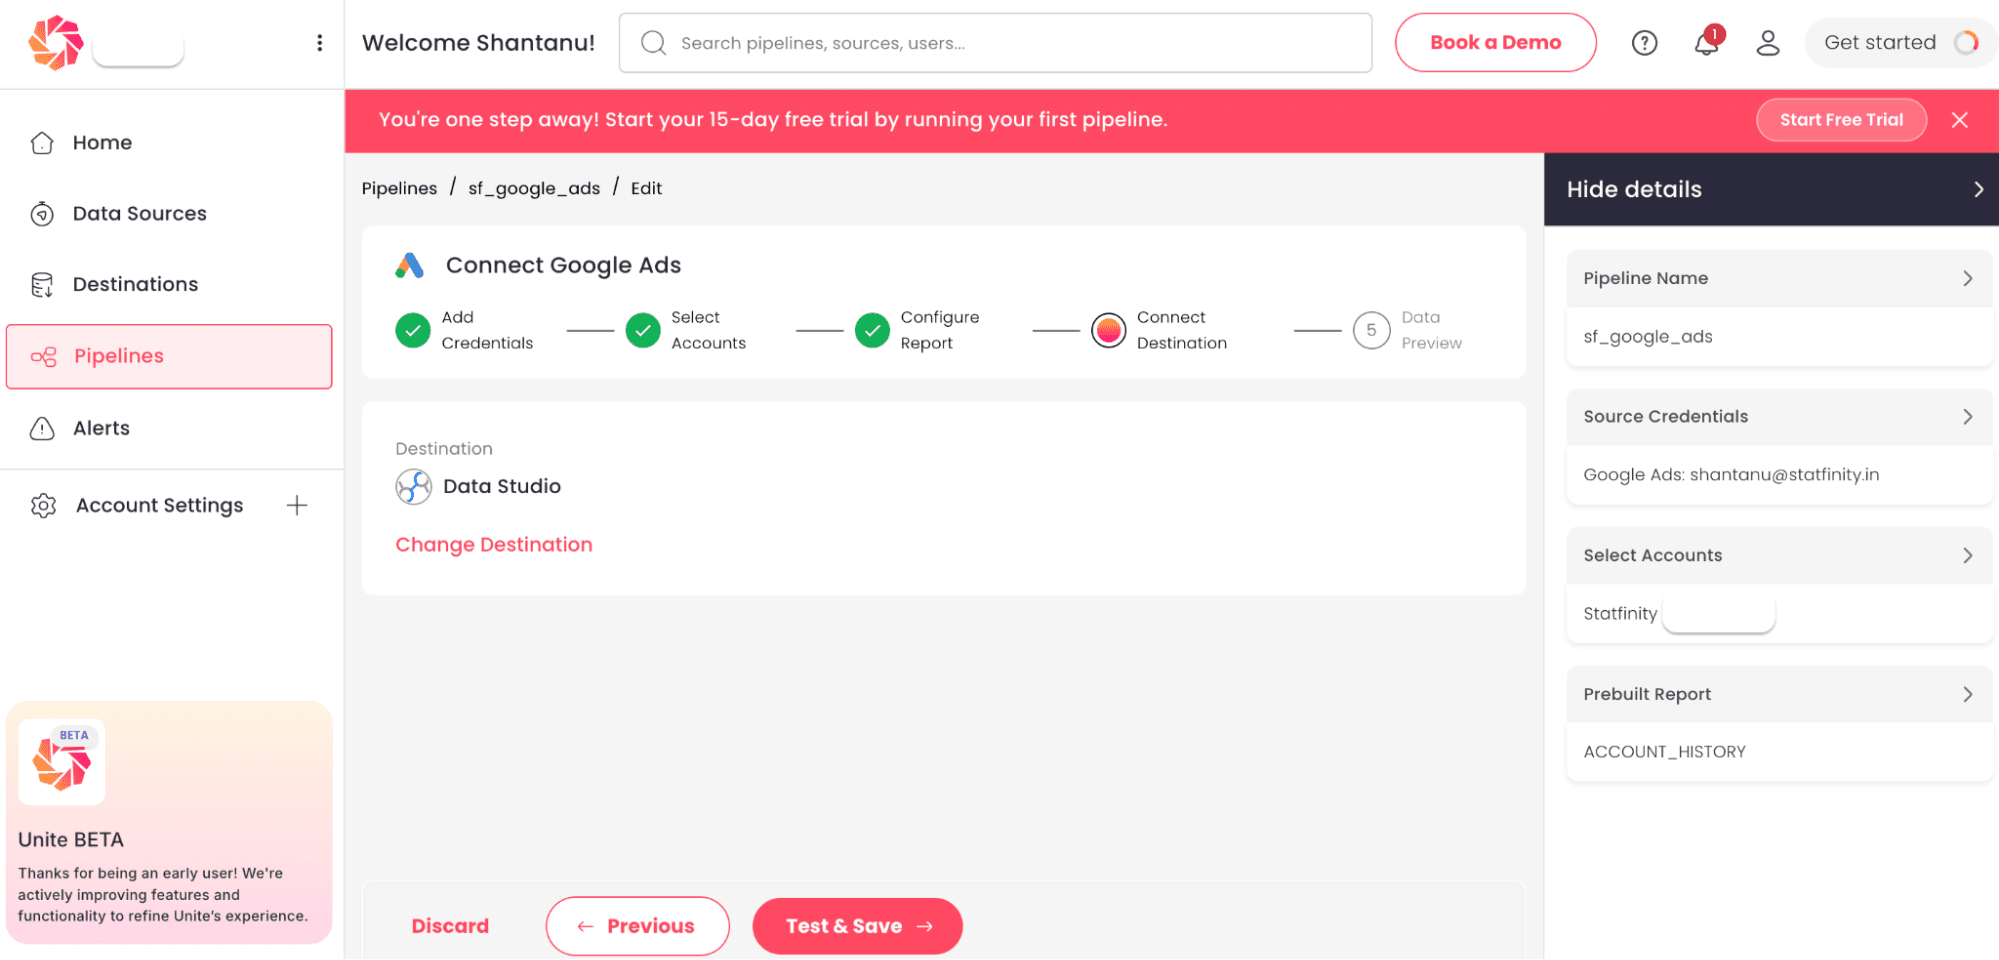
10. Review and finish.
Unite verifies the configuration and shows you a preview of the data. Check it looks right, then click Test & Save. That is the pipeline done.
Part 3: Build your report
11. Go back to Data Studio and create a report.
Click Create, then Report, and select Unite again as the connector.
12. Choose your pipeline.
This time Data Studio shows a dropdown listing your Unite pipelines that use Data Studio as their destination. Select the one you just made.
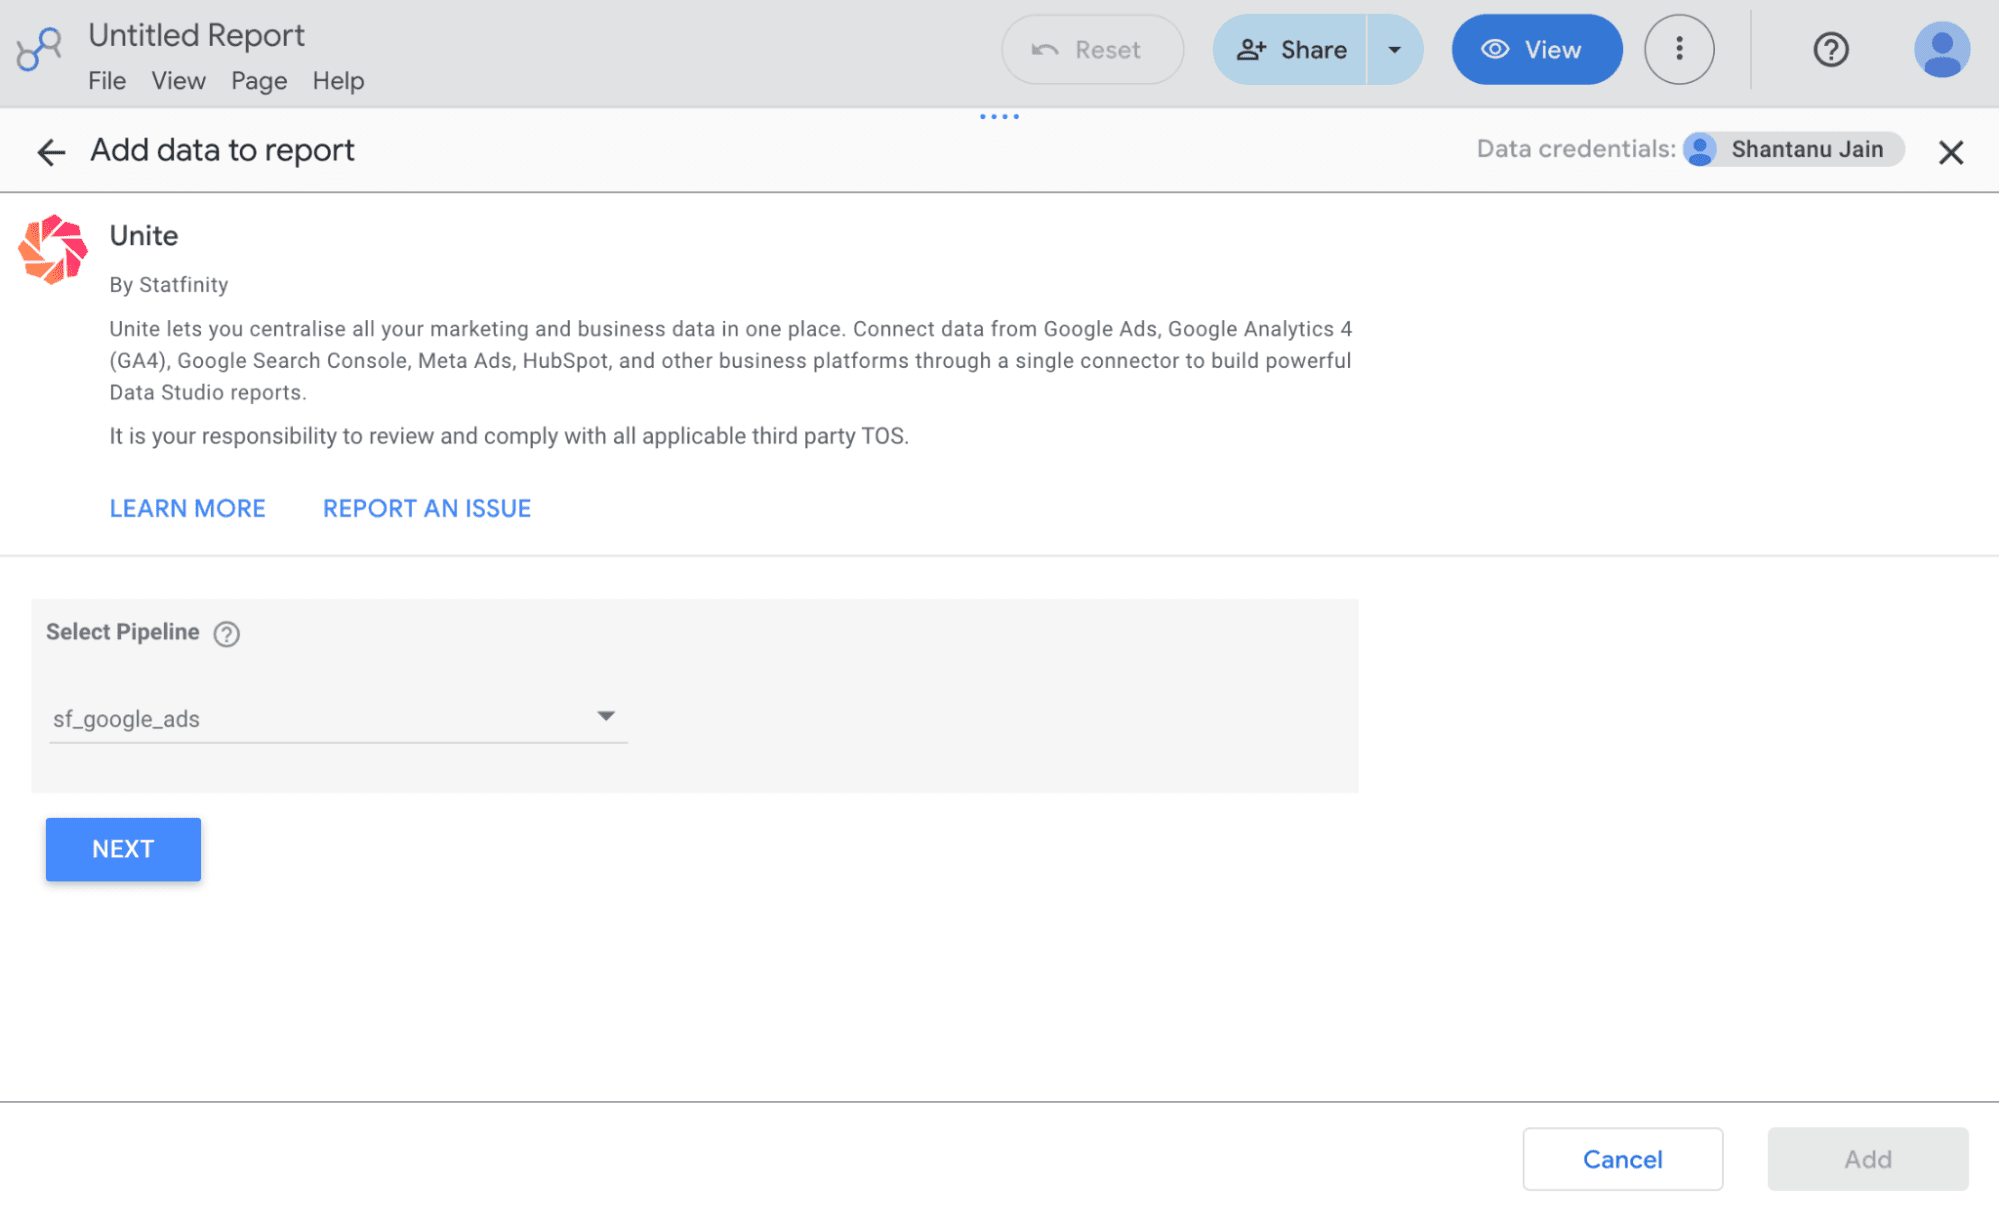
13. Add a chart.
Your data is now available as a data source in the report. Drag a chart onto the canvas, a line chart is a good first test, and pick the dimension and metric you want to see.
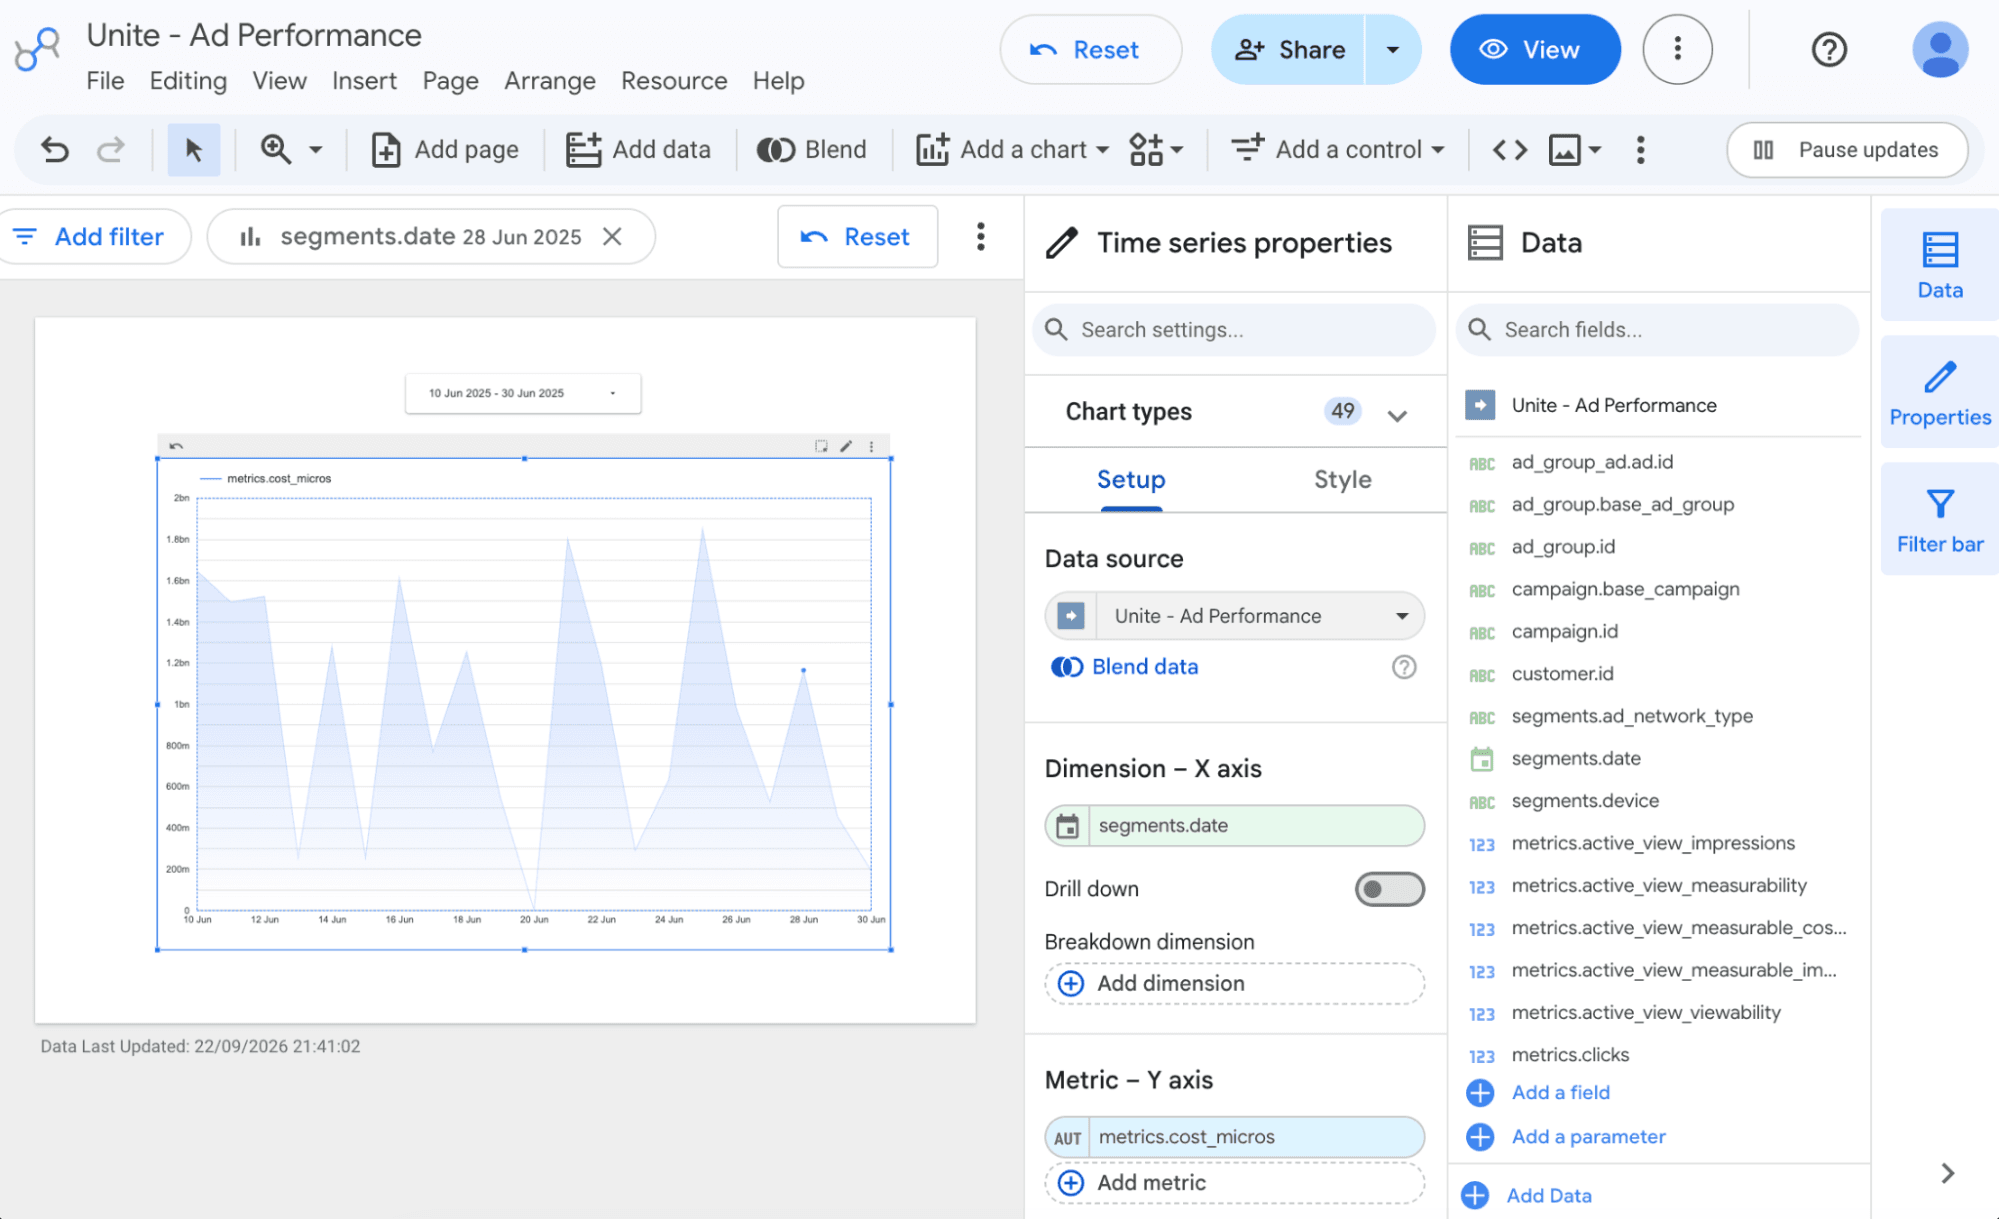
If the chart fills with numbers, you are connected.
How syncing works
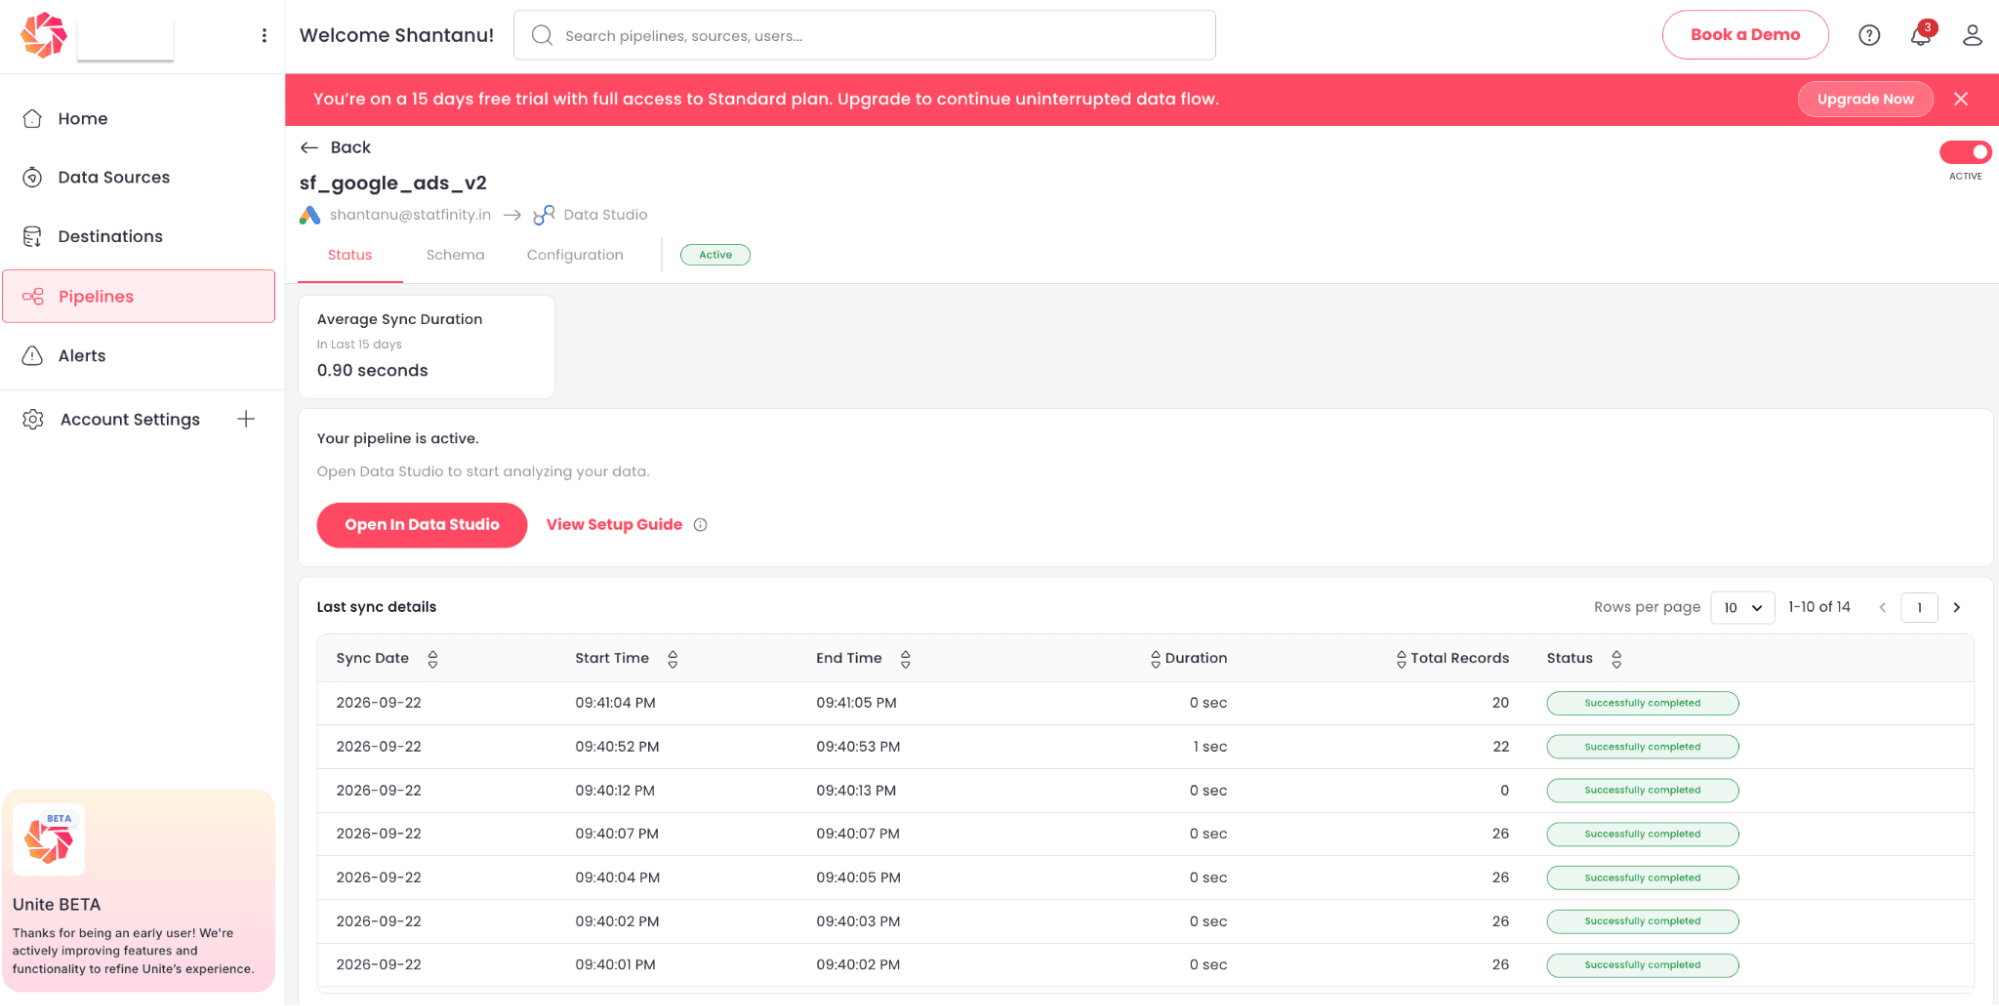
Data Studio does not store your data itself. When a chart needs numbers, it asks Unite, and Unite fetches them from the source. You can watch this happen: change a chart, for example swapping the dimension on the x-axis or adding a metric, and a new sync appears in the pipeline's history in Unite.
Data Studio then caches the result. For the Unite connector, its data freshness setting is 12 hours by default, so if the same chart loads again within that window, Data Studio shows the stored result rather than asking Unite again. That keeps reports quick and avoids pulling identical numbers over and over.
When you need the latest numbers sooner, you have two options:
- Refresh on demand. Report editors can click More options, then Refresh data, to pull fresh numbers straight away. Editors can also let viewers refresh charts themselves from the report settings.
- Shorten the window. Whoever edits the data source can change its data freshness setting, if 12 hours is too long for how the report is used.
For most marketing and sales dashboards, which get checked daily or weekly, the default is fine.
Shortcuts into Data Studio from Unite
Once a pipeline exists, you do not have to start from the Data Studio side each time.
- From the Schema tab: open the pipeline in Unite, go to the Schema tab, and open any of its reports directly in Data Studio.
- From the Status tab: click Open in Data Studio to jump straight into a report.
Both are quicker than searching for the connector again when you want to spin up a new dashboard from a pipeline you already have.
A few tips before you build more
One pipeline per purpose.
A weekly paid media report and a monthly board summary want different accounts and reports. Separate pipelines keep each dashboard fast and easy to follow.
Blend in Data Studio, not in spreadsheets.
Once Google Ads and Meta Ads are both arriving through Unite, you can blend them in a single Data Studio chart to compare spend and results side by side, which is usually the reason people went looking for connectors in the first place.
Know when to add a warehouse.
Sending data straight to Data Studio is ideal for dashboards. If you later want to keep full history, join data in SQL, or let an AI assistant query it, point the same source at BigQuery instead. Our guide to connecting Google Ads to BigQuery covers that route.
Frequently asked questions
Do I need BigQuery or another warehouse to use Unite with Data Studio?
No. The Data Studio destination sends data from your source straight into Data Studio, with no warehouse in between.
Do I need to set up a Data Studio destination in Unite first?
No. Unlike other destinations, Data Studio can be selected directly while you build the pipeline. There is nothing to configure beforehand in Unite.
Why don't I see my pipeline in the Data Studio dropdown?
The dropdown only lists pipelines that have Data Studio selected as their destination. Check that the pipeline was finished and that Data Studio was chosen as the destination.
How fresh is the data in my report?
Data Studio caches results from Unite for up to 12 hours by default. Changing a chart triggers a new request, and report editors can pull the latest numbers at any time with More options, then Refresh data.
Watch the walkthrough
Prefer to see it done? The video below covers every step in this guide in about five minutes, from finding Unite in Data Studio to the first chart.
Get started
If you have been exporting CSVs to get Meta or Shopify numbers next to your Google Ads data, this is the fifteen minutes that ends that routine. Build one pipeline, drag one chart onto a report, and the rest follows the same pattern.
Start your free 15 day Unite trial and send your first source to Data Studio today. No card required.
Want the dashboard built for you?
Unite is built by Statfinity, a data and analytics consultancy that designs Data Studio dashboards for marketing and e-commerce teams across the US, EU and India. If you would rather hand over the brief than build it yourself, from connecting the sources to the finished report, tell us what you want to track and we will tell you what it takes.
LET’S BUILD SMARTER DATA PIPELINES — TOGETHER.
Whether you're migrating from another ETL platform or starting fresh, Unite helps your team launch reliable data pipelines fast. Need a demo, drop us a message below: